
 Oslo Børs
 Stockholmsbörsen
 Københavns Fondsbørs
Investeringsforeninger
Københavns Fondsbørs
Investeringsforeninger
 Helsingin pörssi
 World Indices
 US Stocks
US 30
Nasdaq 100
US 500
US Stocks
US 30
Nasdaq 100
US 500
 Toronto Stock Exchange
 London Stock Exchange
 Euronext Amsterdam
 Euronext Brussel
 DAX
SDAX
TECDAX
CDAX
MDAX
Prime Standard
DAX
SDAX
TECDAX
CDAX
MDAX
Prime Standard
 CAC 40
 Mumbai S.E.
National S.E.
Mumbai S.E.
National S.E.
 Commodities
 Currency
 Cryptocurrency
 Exchange Traded Funds
 Investtech Indices
Hovedindeksen (OSEBX.OL)
Close: 1 500.30 (-17.81), Apr 2, 2025
Complete report
Algorithmic Overall Analysis
Positive (Score: 55)
Apr 2, 2025. Updated daily.
Analyst's Recommendation
Positive
Apr 2, 2025. 0 days ago.
Analyses

Short

Medium
Long
Overall

Insider
Investor Psychology - Behavioural Finance - Quantitative Analysis - Scientific Methods
Technical Analysis - Insider Trades - Seasonal Variations - Intraday Trading
Stock data
| Price date | Apr 2, 2025 |
| Currency | NOK |
| ISIN | NO0007035327 |
| Rise from year low | 11.98% |
| Fall from year high | -2.83% |
Automatic technical analysis. Short term

Short term
Investors have paid higher prices over time to buy Hovedindeksen and the index is in a rising trend channel in the short term. This signals increasing optimism among investors and indicates continued rise. The index has broken down through support at points 1508. This predicts a further decline. In case of positive reactions, there will now be resistance at points 1508. Volume has previously been low at price tops and high at price bottoms. This weakens the rising trend and could be an early signal of a coming trend break. The index is overall assessed as technically negative for the short term.Recommendation one to six weeks: Negative (Score: -59)
Automatic technical analysis. Medium term

Medium term
Hovedindeksen shows strong development within a rising trend channel in the medium long term. This signals increasing optimism among investors and indicates continued rise. It also gave positive signal from the rectangle formation at the break up through the resistance at 1478. Further rise to 1545 or more is signaled. The index has support at points 1460 and resistance at points 1543. The RSI curve shows a rising trend, which supports the positive trend. The index is overall assessed as technically positive for the medium long term.Recommendation one to six months: Positive (Score: 78)
Automatic technical analysis. Long term

Long term
Investors have paid higher prices over time to buy Hovedindeksen and the index is in a rising trend channel in the long term. Rising trends indicate that the market experiences positive development and that buy interest among investors is increasing. There is no resistance in the price chart and further rise is indicated. In case of a negative reaction, the index has support at approximately 1300 points. The index is assessed as technically positive for the long term.Recommendation one to six quarters: Positive (Score: 88)
Full history

Candlesticks 95 days

Candlesticks 22 days

Insider Trades

Insider trades reported last 18 months. The stock is neutral on Insider Trades.
| Date | Type | Count | Price | Value | Percent | Controlled | Text | Importance |
|---|
Commentaries
Automatic technical analysis of the stock, based on last closing price. The chart may have changed since the analyst's recommendation was written.
Analyst's Recommendation
Apr 2, 2025 (0 days ago)Fredrik Dahl Bråten
fredrik.braten@investtech.com
Recommendation one to six months: Positive
Fredrik Dahl Bråten, Apr 2, 2025 (price 1 500.30)
Det ble en negativ utvikling i markedet onsdag, og Hovedindeksen endte på 1500 poeng, noe som er en nedgang på 1.2 prosent.Hovedindeksen har gått til nytt rekordnivå en rekke ganger i år og ligger i en stigende trendkanal på mellomlang sikt. Det er støtte rundt 1460, og så lenge indeksen holder seg over det nivået, er det tekniske bildet positivt og en videre oppgang indikeres. Etter negativ kursutvikling de siste dagene er det etablert motstand ved 1540 kroner. Brudd opp gjennom nivået vil utløse et nytt kjøpssignal for Hovedindeksen.
Volumutviklingen er imidlertid negativ etter fall på høyt volum tidlig i mars, samtidig med at reaksjoner opp har kommet på mer beskjedent volum. Det er et svakhetstegn. Brudd under 1460, spesielt om trendgulvet rundt 1440 poeng også brytes, vil signalisere en svakere stigningstakt for indeksen fremover.
Se også Investtechs likeveide indeks for Norge.
Investtechs kortsiktige optimismeindeks ligger på 48 poeng og den langsiktige ligger nå på 47 poeng. Indeksene viser at det nå er likevekt mellom pessimister og optimister i markedet på kort og lang sikt.
Styremedlemmer, direktører og andre innsidere har rapportert 99 handler den siste måneden. Kjøpsandelen var 85 prosent, noe som er godt over gjennomsnittet for det siste året. En svært stor overvekt av innsiderne som har handlet, sender positive signaler om aksjene i egen bedrift.
Konklusjon:Oslo Børs anses positiv på mellomlang sikt (1-6 måneder). Vi anbefaler langsiktige investorer å være investert i markedet hele tiden.
Recommendation one to six months: Positive
Published: Morning Report (Apr 2, 2025 21:36) [FDB]
The analysis is written by Investtech's analyst on the given date based on the price charts of this date. The analysis is meant to be valid for a few weeks, up to a few months. Later price developments may indicate changes in the market and investor optimism, and render the analysis outdated. Investtech's automatic analyses, updated daily, will often reflect such changes.
Previous recommendations
Fredrik Dahl Bråten, Mar 18, 2025 (price 1 532.87)
Det ble en svak stigning i markedet tirsdag, og Hovedindeksen endte på 1533 poeng, noe som er en oppgang på 0.6 prosent. Dette var den fjerde dag på rad indeksen steg og den siste uken har indeksen steget hele 3.9 prosent.
Hovedindeksen har nådd nytt rekordnivå og ligger i en stigende trendkanal på lang sikt. Det er støtte rundt 1460, og så lenge indeksen holder seg over det nivået, er det tekniske bildet positivt og en videre oppgang indikeres.
Volumutviklingen er imidlertid nå negativ etter fall på høyt volum tidlig i mars, samtidig med at reaksjoner opp har kommet på mer beskjedent volum. Det er et svakhetstegn. Brudd under 1460, spesielt om trendgulvet rundt 1440 poeng også brytes, vil signalisere en svakere stigningstakt for indeksen fremover.
Se også Investtechs likeveide indeks for Norge, som nå er teknisk nøytral.
Investtechs kortsiktige optimismeindeks ligger på 44 poeng etter å ha steget 13 poeng den siste uken. Den langsiktige optimismeindeksen ligger på 48 poeng. Indeksene viser at det er en liten overvekt av pessimister i markedet på kort sikt, men omtrent jevnt på lang sikt.
Styremedlemmer, direktører og andre innsidere har rapportert 121 handler den siste måneden. Kjøpsandelen var 84 prosent, noe som er over gjennomsnittet for det siste året. En stor overvekt av innsiderne som har handlet, sender positive signaler om aksjene i egen bedrift.
Konklusjon:Oslo Børs anses positiv på mellomlang sikt (1-6 måneder). Vi anbefaler langsiktige investorer å være investert i markedet hele tiden.
Published: Morning Report (Mar 18, 2025 19:08) [FDB]
Fredrik Dahl Bråten, Mar 10, 2025 (price 1 490.91)
Det ble en positiv utvikling i markedet fredag, og Hovedindeksen endte på 1491 poeng, noe som er en oppgang på 1.0 prosent. For uken som helhet viste indeksen bare en svak endring på +0.1 prosent.
Hovedindeksen ligger i en stigende trendkanal på lang sikt. Det er støtte rundt 1460, og så lenge indeksen holder seg over det nivået, er det tekniske bildet positivt og en videre oppgang indikeres.
Volumutviklingen er imidlertid nå negativ etter fall på høyt volum tidlig i mars, samtidig med at reaksjoner opp har kommet på mer beskjedent volum. Det er et svakhetstegn. Brudd under 1460, spesielt om trendgulvet rundt 1440 poeng også brytes, vil signalisere en svakere stigningstakt for indeksen fremover.
Se også Se også Investtechs likeveide indeks for Norge, som nå har blitt teknisk negativ.
Investtechs kortsiktige optimismeindeks ligger på 33 poeng og den langsiktige ligger ved 47 poeng etter fall på henholdsvis 9 og 7 poeng siste uke. Det store fallet indikerer at optimismen i markedet har svekket seg betydelig, og at det nå, spesielt blant de kortsiktige investorene, er en overvekt av pessimister.
Styremedlemmer, direktører og andre innsidere har rapportert 104 handler den siste måneden. Kjøpsandelen var 82 prosent, noe som er litt over gjennomsnittet for det siste året. En stor overvekt av innsiderne som har handlet sender positive signaler om aksjene i egen bedrift. Vi regner med mange innsidehandler de kommende ukene, nå som de fleste selskapene har sluppet sine rapporter for fjerde kvartal. Spesielt for de litt mindre selskapene kan innsiderne gi gode signaler om forventninger til aksjekursen framover.
Det langsiktige tekniske bildet er klart positivt, men det har vært negative skift i både volumutvikling, hausseindekser og den likeveide indeksen den siste uken. Vi nedgraderer vårt markedssyn til svakt positivt.
Konklusjon:Oslo Børs anses svakt positiv på mellomlang sikt (1-6 måneder). Vi anbefaler langsiktige investorer å være investert i markedet hele tiden.
Med uro på de internasjonale børsene ser vi i dag på tre sparebanker som i mange år har prestert jevnt godt, og nå kan være en trygg havn for sparepengene. Merk at flere av sparebankene er mindre selskaper med lav omsetning på børsen. Det kan derfor være vanskelig å handle større volum uten å flytte kursen.
Published: Morning Report (Mar 10, 2025 00:00) [FDB]
Analysts' recommendations last 18 months

Positive/Weak Positive
Neutral
Negative/Weak Negative
History of Investtech's analysts' analyses of the stock. Analyses are shown by coloured dots on the day the analysis was based on.
| Evaluation | Time horizon | Price | Published | Analyst |
|---|---|---|---|---|
 Positive Positive | Medium term | 1 500.30 | Apr 2, 2025 21:36, Morning Report | FDB |
| Positive | Medium term | 1 532.87 | Mar 18, 2025 19:08, Morning Report | FDB |
 Weak Positive Weak Positive | Medium term | 1 490.91 | Mar 10, 2025 00:00, Morning Report | FDB |
| Positive | Medium term | 1 472.83 | Jan 13, 2025 08:41, Morning Report | GL |
| Weak Positive | Medium term | 1 469.54 | Jan 7, 2025 23:48, Morning Report | FDB |
 Neutral Neutral | Medium term | 1 414.24 | Dec 18, 2024 19:01, Morning Report | FDB |
| Weak Positive | Medium term | 1 449.88 | Oct 29, 2024 07:59, Morning Report | KP |
| Positive | Medium term | 1 461.21 | Oct 27, 2024 19:40, Morning Report | FDB |
| Weak Positive | Medium term | 1 361.58 | Aug 6, 2024 08:37, Morning Report | KP |
| Positive | Medium term | 1 342.78 | Apr 2, 2024 23:56, Morning Report | FDB |
| Weak Positive | Medium term | 1 328.15 | Mar 27, 2024 22:05, Morning Report | FDB |
| Neutral | Medium term | 1 264.02 | Feb 18, 2024 14:53, Morning Report | FDB |
 Weak Negative Weak Negative | Medium term | 1 247.17 | Feb 7, 2024 21:33, Morning Report | FDB |
| Neutral | Medium term | 1 271.16 | Jan 17, 2024 20:26, Morning Report | FDB |
| Weak Positive | Medium term | 1 303.96 | Jan 9, 2024 08:13, Morning Report | KP |
| Positive | Medium term | 1 307.12 | Jan 4, 2024 21:46, Morning Report | GL |
| Neutral | Medium term | 1 299.85 | Nov 28, 2023 23:43, Morning Report | FDB |
| Weak Positive | Medium term | 1 315.22 | Nov 27, 2023 07:21, Morning Report | FDB |
| Neutral | Medium term | 1 281.17 | Nov 2, 2023 08:51, Morning Report | FDB |
FDB: Fredrik Dahl Bråten (Analyst)
GL: Geir Linløkken (Head of Analyses)
KP: Kari Poblete (Analyst)
Results analysis
Average price development

Seasonal variations
Seasonal prediction from today's date

The blue line shows average price development the past 10 years, in the period from three months before to six months after today's date. The black line is actual price development in the past three months. Shaded areas are one and two standard deviations.
Monthly and annual statistics

Average development per month, last 10 years

Average development throughout the year, last 10 years
Annual development from 2015 to 2024

2015

2016

2017

2018

2019

2020

2021

2022

2023

2024
Trading limits
Data missingEarly warning
| Close prices next day that when broken will generate new signals |  | |
|---|---|---|
| Indicator | Price | Objective |
| High-RSI | 1 578.50 | - |
| Last close | 1 500.30 | - |
| Short Term Trading Range | 1 462.30 | - |
| Long Term Trading Range | 1 462.30 | - |
| Low-RSI | 1 330.27 | - |
| Indicator: | Type of indicator generating the signal | |
| Price: | If close price next day has crossed this value, a technical signal is created | |
| Objective: | Price target for the positive or negative signal (Only listed for patterns) | |
Alerts
| Date | Price | Signal/Trading opportunity | Time span | Target |
|---|---|---|---|---|
| Mar 28, 2025 | 1 513.98 | Double Top Pattern | Short term | 1 518.57 |
| Apr 2, 2025 | 1 500.30 | Reaction back after formation buy | Medium term | 1 538.00 - 1 562.00 |
Key ratios
Data missingHelp and information - Research shows the importance of Trend, Momentum and Volume
Investtechs analyses focus on a stocks trend status, short term momentum and volume development. These are central topics of technical analysis theory that describe changes in investor optimism or fluctuations in a companys financial development. However, Investtechs strong focus on these elements is due to research results that clearly indicate causation between these factors and future return on the stock market.
Trend

Theory: Stocks in rising trends will continue to rise.
Psychology/economy: Rising trends indicate that the company experiences positive development and increasing buy interest among investors. Read more
Research: Stocks in rising trend channels in Investtechs medium long term charts have been followed by an annualized excess return of 7.8 percentage points compared to average benchmark development. This is shown by Investtechs research into 34,880 cases of stocks in rising trends on the Nordic Stock Exchanges in the period 1996 to 2015.
Read more about the research results here
Momentum

Theory: Stocks with rising short term momentum will continue to rise. Stocks with very strong momentum (overbought) will react backwards.
Psychology/economy: RSI above 70 shows strong positive momentum. The stock has risen in the short term without any significant reactions downwards. Investors have kept paying more to buy stocks. This indicates that more investors want to buy the stock and that the price will continue to rise. Read more
Research: Stocks with strong momentum have on average continued to rise, and more so than the average stock listed on the Exchange. This is shown by Investtechs research into 24,208 cases of stocks on the Nordic Stock Exchanges in the period 1996 to 2015 where RSI went above 70 points, indicating strong and increasing short term momentum. On average, annualized, the stocks rose the equivalent of 11.4 percentage points more than the average stock.
Read the research report here
Volume

Theory: Rising prices on high volume and falling prices on low volume indicate strength in a stock. Volume can confirm a rising trend or signal that a falling trend is ending.
Psychology/economy: When investors very much want to buy a stock, they have to increase the price to find new sellers. Rising price on high volume shows that some investors are so aggressive that they push the price up to be able to buy the stock. Investtechs Volume Balance tool measures the relation between price rise and volume and measures investor aggression at rising and falling prices. Read more
Research: Stocks with volume balance above 40 have been followed by an average annual return of 4.7 percentage points on the Nordic Stock Exchanges, shown by research conducted by Investtech into 24,580 cases.
Read the research report here
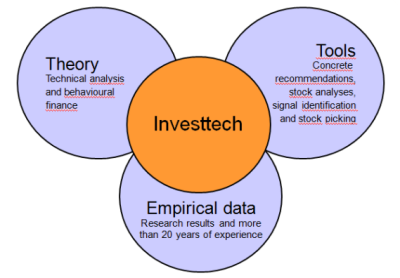
Investtech's analyses
Investtech has combined theory, psychology and research into powerful investment tools.
About Investtech
Investtech are behavioural finance and quantitative stock analysis specialists. The company sells analysis products to private, professional and institutional investors. Investtech manage the AIFM company Investtech Invest, which invests customers funds in the stock market.
Investtechs computers analyze more than 28,000 stocks from 12 different countries every day. The analyses are presented in eight languages and sold to customers worldwide. In addition to the automatic analyses, the companys analysts present subjective assessments and recommendations for some markets. The analyses are available to customers in the form of daily morning reports and cases, and weekly market updates and model portfolios.
Investtechs algorithms for analysis, ranking and stock recommendations are based on research dating back to 1993. Part of the research was conducted in cooperation with Oslo University and the Norwegian Research Council. Research still has high priority for Investtech. Many of the companys research results are available for customers on the companys web site.
The companys basic product starts at approx. 30 euro per month. Investtech also provides bespoke products for integration on partners web sites and for use in newsletters, for example to stock brokers and the media. Contact us by e-mail to info@investtech.com or by phone +47 21 555 888 for more information. A free trial subscription is available to order on our web site www.investtech.com.

Head Office
Investtech ASStrandveien 17
1366 Lysaker
+47 21 555 888
Postal address
Investtech ASStrandveien 17
1366 Lysaker
info@investtech.com
VAT no. 978 655 424 MVA
Research Department
Instituttveien 102007 Kjeller
www.investtech.com
Investor Psychology - Behavioural Finance - Quantitative Analysis - Scientific Methods
Technical Analysis - Insider Trades - Seasonal Variations - Intraday Trading
Investtech guarantees neither the entirety nor accuracy of the analyses. Any consequent exposure related to the advice / signals which emerge in the analyses is completely and entirely at the investors own expense and risk. Investtech is not responsible for any loss, either directly or indirectly, which arises as a result of the use of Investtechs analyses. Details of any arising conflicts of interest will always appear in the investment recommendations. Further information about Investtechs analyses can be found here disclaimer.
The content provided by Investtech.com is NOT SEC or FSA regulated and is therefore not intended for US or UK consumers.
Copyright Ⓒ 1997-2025 Investtech.com AS, Org nr 978 655 424 MVA Privacy Policy | Disclaimer | Sustainability Strategy
Head office
Strandveien 171366 Lysaker, Norway
Research department
Instituttveien 102007 Kjeller, Norway
×
